What Actually Happened During Your Campaign
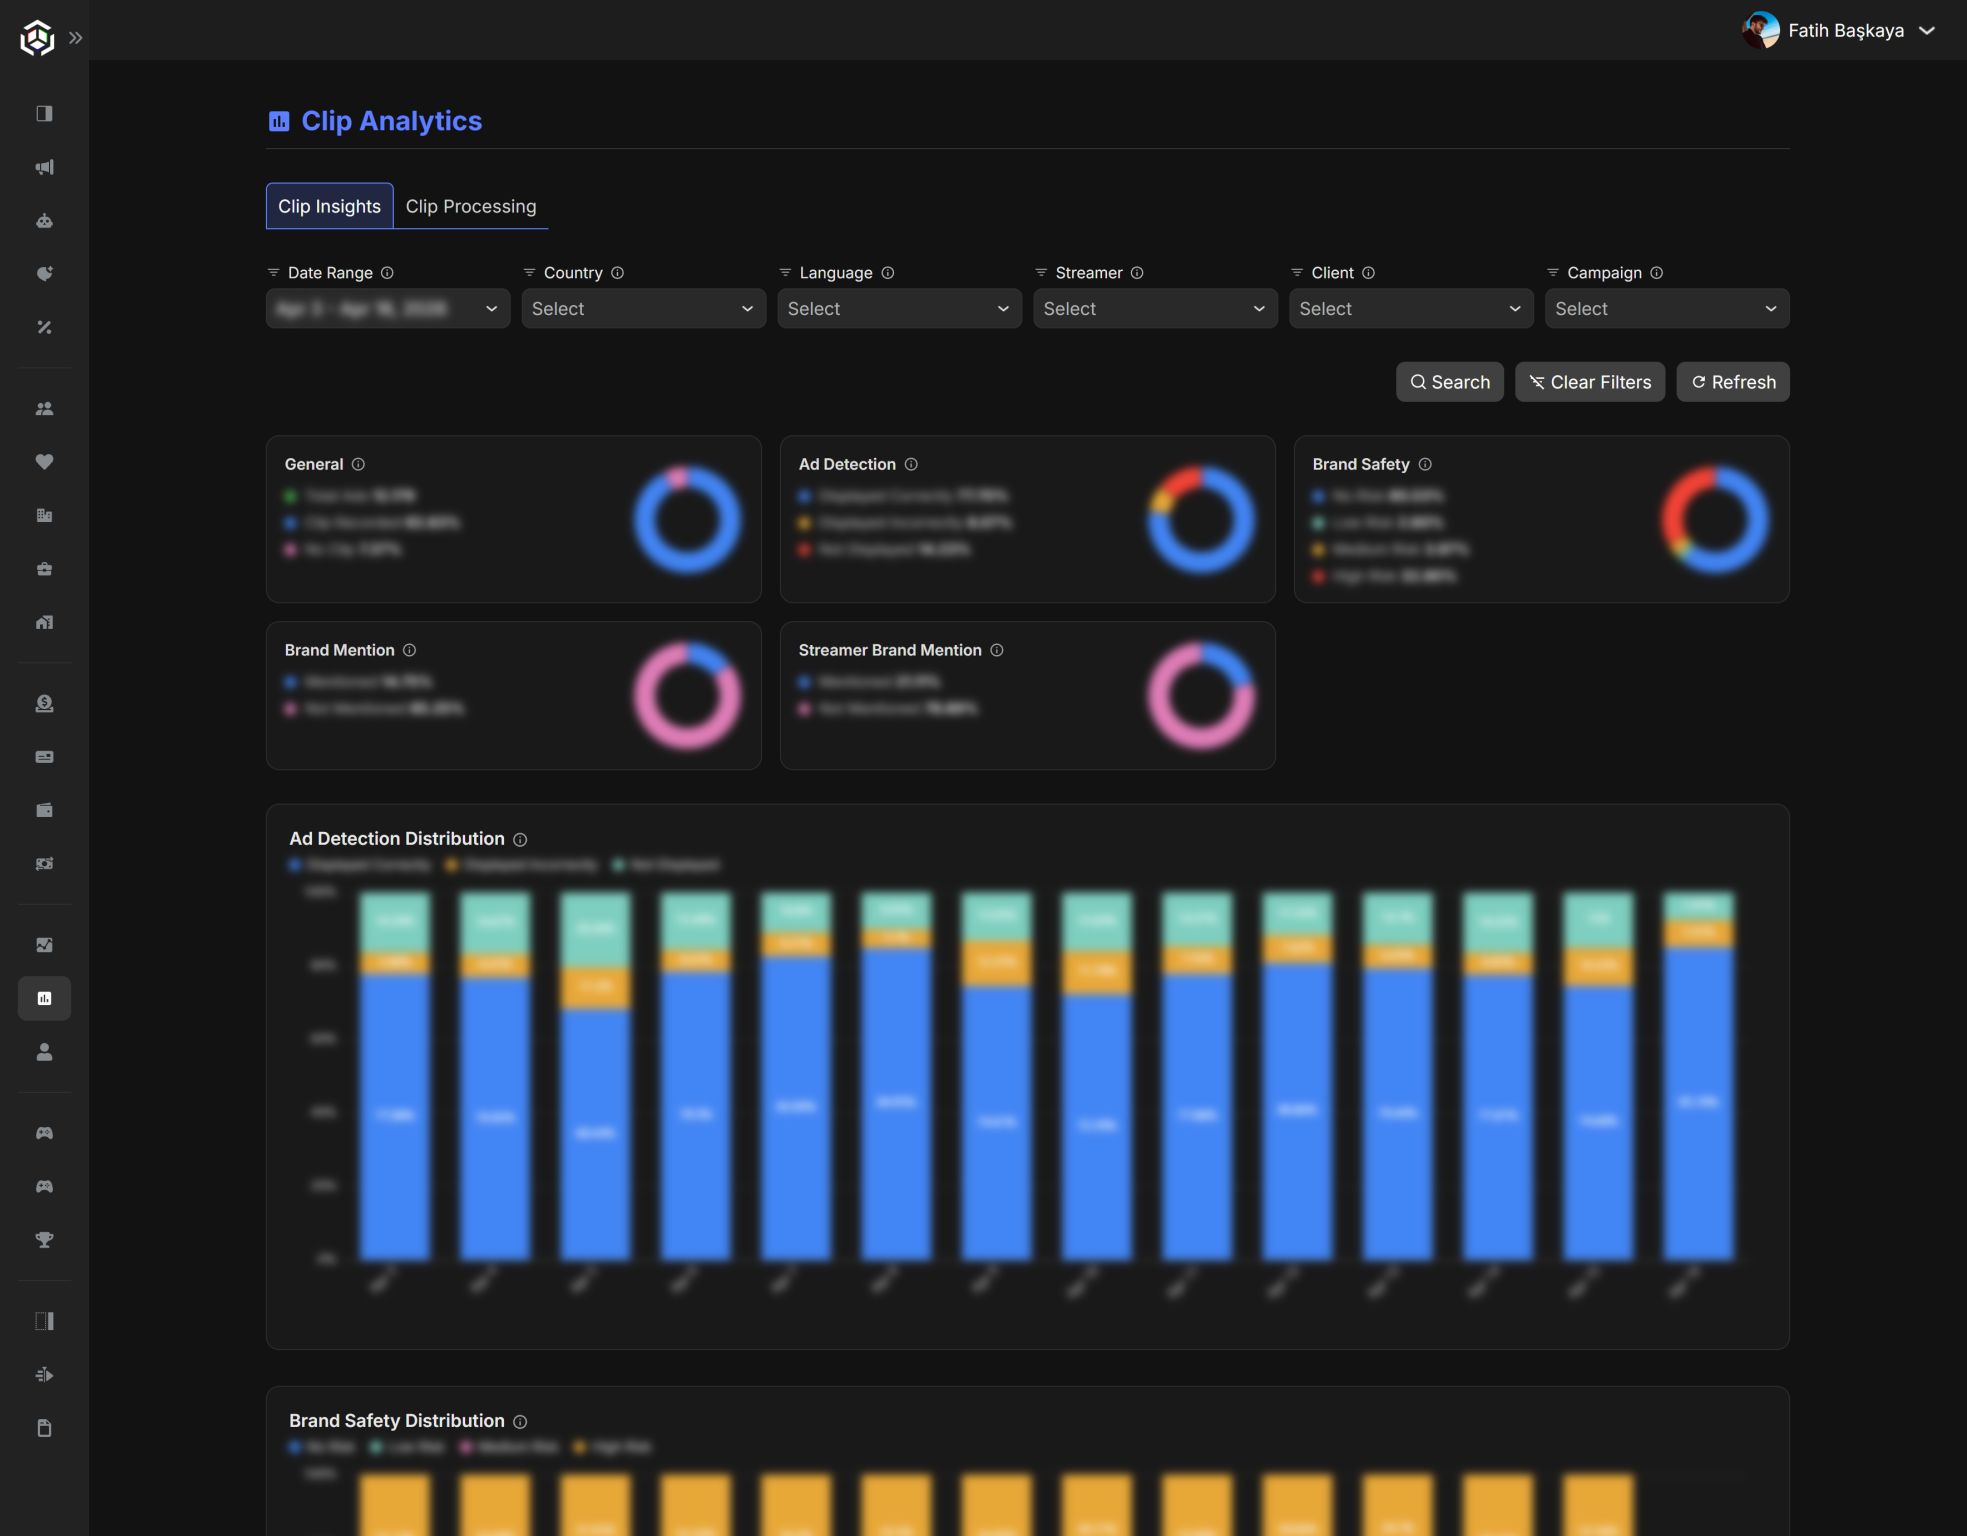
A campaign report is a summary of something you did not watch.
That is the uncomfortable thing about live streaming as a channel. The inventory is thousands of hours of video that aired once, in real time, on someone else's channel, while you were asleep or in a meeting. By the time you see a number, the thing the number describes is gone.
So you get a deck with impressions on it and you are asked to trust it. Did the ad display correctly? Did the streamer actually mention the brand? Was the surrounding content safe to be next to? Every brand asks these after a campaign, and historically the answer has been a shrug wrapped in a chart.
Clip Analytics exists so that the answer is a link instead.
Two halves
Clip Insights covers the questions about quality: ad display quality, brand safety, and brand mention analysis. Not just whether an ad was served, but whether it rendered the way it was supposed to, what it sat next to, and whether the streamer said anything about the brand at all.
Clip Processing covers the questions about completeness. It tracks the full pipeline status of every clip, so you can see what has been processed, what is in flight, and what failed. Analytics that quietly drop data are worse than no analytics, because they look confident.
The part I care about most
Charts summarize. That is their job, and it is also their weakness. A bar is a claim about a few hundred things you cannot see.
The feature I pushed hardest for is drill-down: our commercial partners can click any bar in any chart and browse the individual ads behind that data point. The summary opens up. You go from "brand safety looked fine this week" to actually looking at the placements that produced that score.
This matters because it turns reporting into something you can act on mid-campaign. If one streamer is dragging a metric down, you find them by clicking, not by asking someone to pull a custom export and waiting two days. It connects directly to the swap-and-optimize flow in Streamer Explorer, which I wrote about separately. Seeing the problem and fixing it should be the same session.
The rest
Daily breakdowns, multi-day selection, and CSV export are all in there. Nothing exciting, all necessary. Anyone who has tried to reconcile a media report against an internal system knows that the export button is not a nice-to-have.
Accountability as a feature
Live streaming spent years being sold on reach and vibes because that was all anyone could measure. I think the channel grows up when brands stop being asked to take the numbers on faith.
Every ad, every streamer, every second, and a way to go look at any of it.